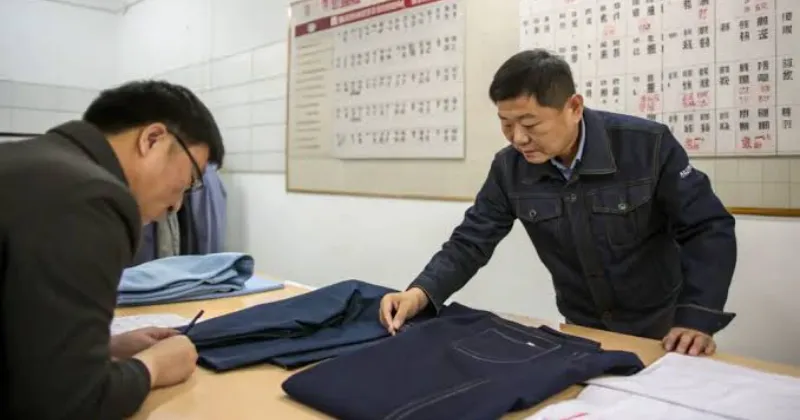
Factories rarely fail from sudden demand. They fail when leaders try to scale production without locating the actual constraint. Throwing headcount at unverified bottlenecks multiplies chaos.
At LeelineWear, our operational diagnostic prevents this. My team walks the floor to capture exact cycle times, review quality-loss logs, and validate supplier capacity. I know a line is balanced when I see steady operator cadence, zero overflowing WIP carts, no handoff waiting, and hear no machine alarms.
Throughput improves only when you protect the bottleneck before spending capital. This requires a phased scale-up, not a same-day fix. You will learn to expand without sacrificing quality by stabilizing your constraint first.
Below, we share our line balancing SOP, Principal Production Engineer commentary, and an anonymized predictive maintenance matrix.

Operational Readiness & Diagnostic Framework for Scalable Production
Diagnostic Window: 2 Weeks | Pilot Review Cycle: 30 Days
Assemble the Task Force: Require an operations lead, industrial engineer, production supervisor, maintenance lead, quality manager, supply-chain planner, and finance partner.
Gather Floor Data:
-
Production Metrics: Pull demand forecasts by SKU family, exact routings, BOMs, and staffing matrices.
-
Machine Logs: Export your machine list, maintenance logs, downtime history, scrap data, changeover times, and supplier lead times. A client recently guessed thread changeovers took 15 minutes. Our logs proved they took 43.
-
Cloud SOPs: Host SOPs in a centralized cloud. Printed binders guarantee operators use outdated specs.
-
Safety & Compliance: Enforce machine guarding, change-control discipline, and lockout/tagout rules.
🧠 Expert Take: Never exclude maintenance from scaling plans. When Manager Chen adjusted our Juki 1541 flat-lock machine, he warned: “Speeding up targets without maintenance prep just snaps needles faster.”
— Liangjie Wu, Chairman & Expert in Industrial Sewing Machines
How to Scale Your Factory Floor Without Breaking Operations?
Step 1: Translate Demand Into Hard Operational Targets

Frantic expediting is not scaling. A healthy factory floor feels paced, predictable, and remarkably boring. Last quarter, I audited a line that “looked busy,” yet they continually missed output targets because operators simply stood waiting between the cutting and sewing stations.
Convert your commercial demand into operational realities. Calculate your required units per day, per shift, and per bottleneck hour.
Define your hard guardrails. You must establish executive risk boundaries before altering the floor. Document your maximum allowable defect rate, target first-pass yield (FPY), and minimum contribution margin. Set strict ceilings for lead times and an overtime cap. Lock in your on-time-delivery (OTD) target.
Separate growth targets from vanity metrics. Do not plan a massive doubling event unless your working capital, validated demand, and supplier responsiveness actually justify it.
Map your targets using a KPI tree. A simple whiteboard and spreadsheet work perfectly for this, though enterprise teams often use ERP-linked dashboards. Ensure you use explicit labels and units so the data is accessible to all stakeholders.
-
Speed: Throughput (units/hour), Takt (minutes/unit), Cycle Time (seconds/operation).
-
Constraint: OEE at the constraint (%), Queue Length (WIP units), Changeover Time (minutes).
-
Reliability: Scrap/Rework (%), Supplier OTIF (%), Schedule Adherence (%).
You will know this step is successful when executives can approve a controlled capacity ceiling without guessing.
⚠️ Experience Warning: Do not push capacity targets in a vacuum. In my experience, scaling an apparel line without verifying your raw material supplier’s OTIF rate will cause massive fabric stockouts within 48 hours.
Step 2: Map the Current State on the Factory Floor
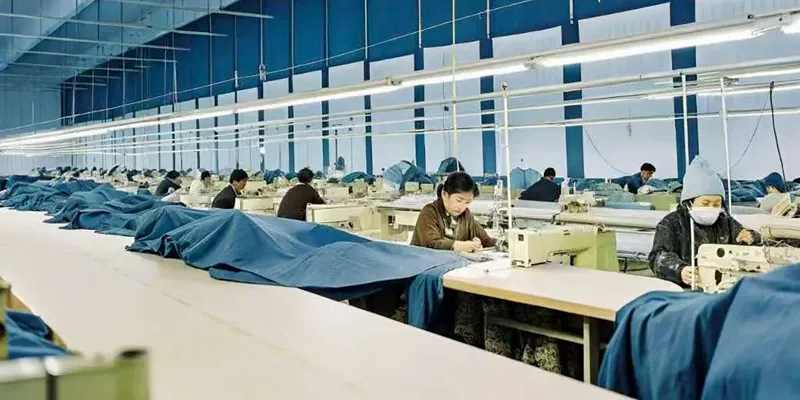
Leave the boardroom and walk the physical floor. In our audits, I locate constraints by feeling the heat buildup near the fusing presses. I also watch the stop-start rhythm of the sewing line.
Walk the exact production path. Follow the material from receiving and kitting to setup and primary assembly. Continue through inspection, finishing, packing, and the shipping handoff. Time each operation with a stopwatch. Record enough cycles to capture real variation. Do not log just one clean run.
At each station, categorize your observations into four buckets. Record the touch time, wait time, queue/WIP, and defect/rework escape points. Build a current-state map on a spreadsheet.
Document the labor count, machine assignments, batch sizes, changeovers, and replenishment triggers. Make your process map accessible. Describe each station by text function, not just by color or icon.
Use manual observation as your primary method. You can layer MES/MOM event data over this later. Next, pull recent historical evidence. Review downtime codes, absenteeism, scrap by defect type, expedite events, and maintenance logs. Map how these bottlenecks impact your wider fashion supply chain.
Last Tuesday, Line Supervisor Yin pointed to overflowing carts near the flat-lock machines. She warned: “By mid-shift, work stacks up here because operators wait 12 minutes for elastic.”
Your map is complete when every operation has an owner. It must also show a measurable cycle time and a visible downstream dependency.
⚡ Speed Verification: Mapping a 50-person line manually takes us roughly three days. Do not rely solely on software data. System logs routinely miss human queueing and operator walking time.
Step 3: Identify and Rank the True Bottlenecks
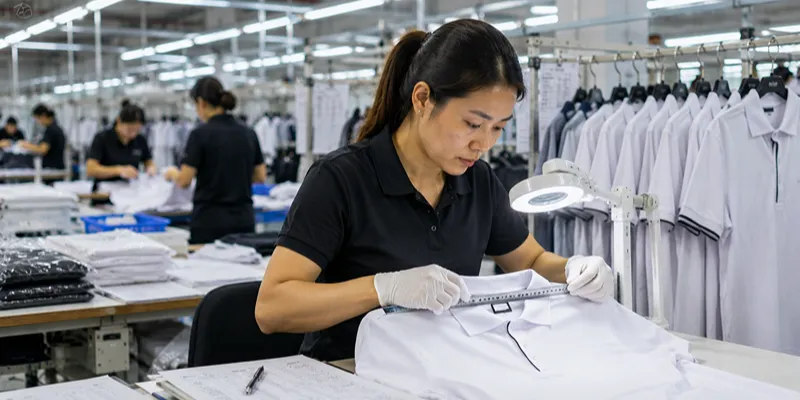
In my experience, a true bottleneck is loud and obvious. Look for the physical signals on the floor. WIP keeps growing before one station. Downstream stations starve. The machine is almost never idle. Small stops instantly hit your daily output.
Calculate your takt time first. Divide your available production time by the required output for your target demand.
Build an operator-machine matrix. Create a simple Yamazumi-style workload view for every station to visualize the burden.
Compare each station’s cycle time against your takt. Flag any step that exceeds takt or creates repeated queue growth.
Check the bottleneck three ways so your team does not chase the wrong constraint:
-
Compare the cycle time versus takt.
-
Observe blocking and starving directly on the floor.
-
Review OEE, downtime, and quality loss at the suspected constraint.
Separate chronic constraints from temporary noise. A station with one bad shift is not automatically the bottleneck.
Model the doubled-output scenario. Identify exactly which station breaks first at 1.2x, 1.5x, and 2.0x demand. Note the exact limiting factor. Determine if it is labor, machine uptime, tooling, changeovers, inspection, or material feed. Consult official OEM Throughput Guidelines to verify your machinery limits before scaling.
End with a ranked constraint list. Categorize your solutions into quick fixes, medium-cost fixes, and capex-trigger fixes.
You will know this step is complete when you hold a prioritized list of verified physical limits, not management assumptions.
During our last floor audit, Principal Production Engineer Wu pointed out a common failure. He noted: “When you push a batch line toward continuous flow, the material feed usually fails first. Teams speed up the sewing machines but forget that operators now lack the time to stage the next heavy fabric roll.”
Step 4: Secure the Bottleneck with Quality and Predictive Maintenance
Scaling a broken constraint only scales scrap, downtime, and customer complaints. I rely on sensory checks on the factory floor. Listen for unusual noise or repeated micro-stops. Feel for abnormal vibration, rising temperatures, or sticky material feeds.
Watch for operator hesitation. These physical clues prove a process is unstable even when your dashboard looks acceptable.
Document the best-agreed method precisely at your constraint. Define the exact work sequence, staffing pattern, and standard WIP limits. Set strict quality checkpoints and a clear escalation rule when performance drifts.
Tighten your in-process quality control immediately around this bottleneck. Do not rely solely on final inspection. Shift from piece-by-piece checks toward statistically driven sampling only after the output stabilizes.
When verifying complex metrics like UPF testing standards, unstable processes still require heavy, continuous oversight.
Build a predictive-maintenance layer tied to exact bottleneck failure modes. Schedule precise lubrication routines, condition checks, calibration, and wear-part swaps. Track tool life and clean sensors daily.
Mature plants can use CMMS/IIoT-triggered maintenance, but strict standard work remains your primary defense.
Our anonymized telemetry data shows a brutal correlation. Lines hitting 90% predictive-maintenance compliance dropped their downtime to exactly 12% during scale-up. Lines ignoring routines suffered 48% downtime. We rely on this raw operational reality, not marketing theory.
After we locked in this maintenance discipline, my team personally saw the erratic production cadence smooth out entirely.
⚠️ Experience Warning: Do not ignore minor machine faults at the constraint. Last month, a client ignored a sticky feed dog on a primary serger. It caused a 4-hour micro-stop accumulation, entirely destroying their daily output target.
Step 5: Align System Dependencies and Calculate Landed Costs
When I inspect a scaled floor, I look for supporting-capacity mismatches. You will often see machines running perfectly while finished goods pile up near shipping docks. This proves your dependencies failed.
Size every system dependency around your newly stabilized constraint. Calculate exact limits for raw materials, bought-in components, tooling, and fixtures. Expand your QA coverage, operator cross-training, warehouse space, packaging, and outbound freight capacity.
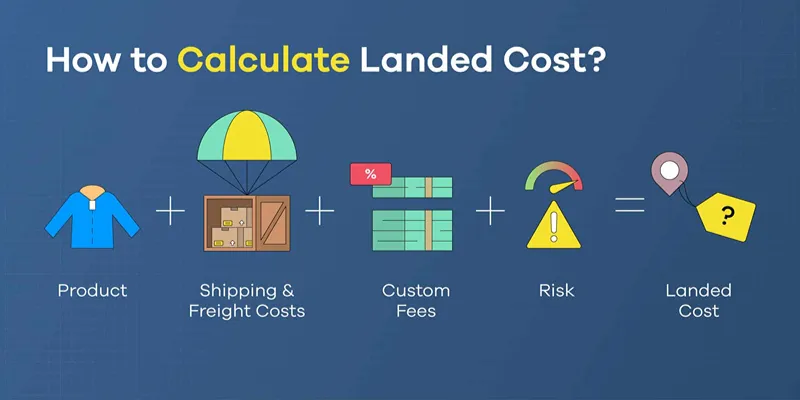
Shift your financial focus to the true landed cost. Include working-capital pressure, startup scrap, spare parts, and overtime in your model. Evaluate freight-mode shifts using an air freight vs sea freight analysis. Factor in new customs duties and extra QA labor.
Audit your supplier capacity immediately. Verify their MOQ and lot-size fit your new volume. Assess lead-time compression risks. Negotiate new payment terms as volume rises. Prepare secondary-source readiness. Implement strict change-control and IP-protection rules if outside partners carry your overflow volume.
Automate only stable, repetitive, high-impact tasks. Add selective parallel labor or subcontract your overflow first. Apply a strict ROI lens to all upgrades. Debottleneck your labor first. Implement low-cost tooling next. Target automation third. Build a new line only if these earlier options fail to close the gap.
You will know this step is successful when finance approves a budget covering the entire supply chain.
⚠️ Experience Warning: Do not scale the constraint blindly. Last quarter, a client scaled sewing output by 40% but ignored their outbound logistics. They lost their entire margin paying emergency air freight to clear a jammed warehouse.
Step 6: Execute the Scaled Pilot with Phase Gates
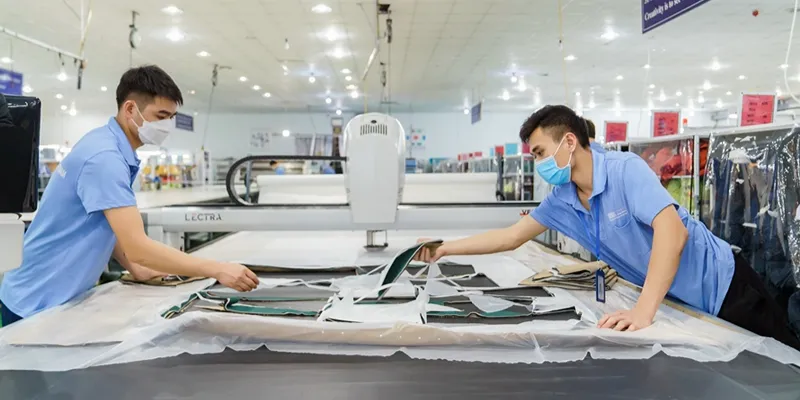
When I oversee a pilot run, I look for a calm floor. A successful pilot feels remarkably boring across a full shift. You will see no frantic firefighting after breaks. You will find no late-shift defect spikes and no repeated line restarts.
Freeze all uncontrolled changes before starting. Do not allow undocumented operator swaps, setup shortcuts, or material substitutions.
Run your scaled pilot in strict stages. Push output to 1.2x, then 1.5x, before attempting your full target.
Review the hard evidence after every phase. Measure throughput at the constraint and your first-pass yield (FPY). Track your queue age, changeover time, and maintenance events. Verify supplier OTIF, labor productivity, and customer-spec compliance.
Enforce a strict go/no-go decision at each gate. If quality or uptime drops, stop the pilot immediately. Return to the bottleneck step instead of forcing volume through. Rely on a physical pilot on the line as your primary method. Advanced teams can use digital-twin simulations first.
If you utilize external expansion models, ensure your manufacturing partner uses these exact validation gates.
⚠️ Experience Warning: Mature operators never jump straight to doubled output. Last year, Line Manager Zhao pushed a batch production line toward continuous flow too quickly.
He warned: “The material feed always fails first when speeds increase. We fixed it by staging the heavy fabric rolls 20 minutes earlier.”
Troubleshooting Common Scale-Up Failures
📝 Editor’s Verdict: Scaling before verifying your true constraint is the ultimate failure. Throwing capital at unverified bottlenecks multiplies chaos.
Output Rises But Defects Spike

Symptom: Rework alarms ring. Scrap bins overflow. Cause: You sped up without stabilizing standard work. Bluntly: scaling a bad process only produces defects faster. Fix: Re-time operations and re-lock SOPs. Add a quality gate at the defect point.
In my experience, speeding up a flat-lock machine before mastering feed tension snaps threads. Lock the tensioner first.
Added Labor Misses Output Targets
Symptom: Five operators stand idle while one drowns in WIP.
Cause: You staffed a non-bottleneck.
Fix: Rerun the line balance check. Compare cycle time to takt time.
Manager Chen added two packers to line three, but output flatlined. The actual bottleneck was a slow upstream fusing press.
Machines Starve for Material
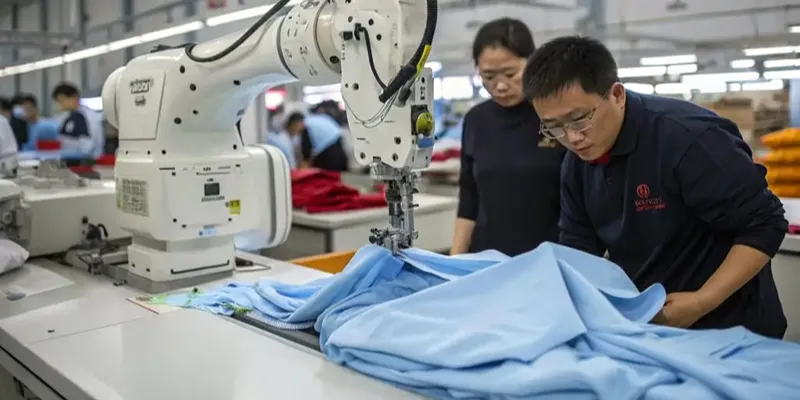
Symptom: The floor falls silent. Operators wait empty-handed.
Cause: Replenishment signals were not scaled for new speeds.
Fix: Recalculate safety stock and align MRP triggers. See our fashion supply chain guide for details.
In our Tuesday stress-test, a 15% speed increase drained fabric buffers in exactly four hours.
Automation Increases Downtime
Symptom: An automated machine flashes red. The line halts.
Cause: You automated an unstable process.
Fix: Simplify the manual process first. Keep a manual bypass ready.
Our laser cutter jammed hourly on Spandex until Worker Wei manually stabilized the fabric tension block.
🛡️ Prevention: Never scale production before physically verifying the true constraint on the floor.
Conclusion
The plant can scale successfully only when throughput, quality, supplier response, and maintenance discipline rise together.
Do not guess your next move. Convert your findings into a strict 30-60-90 day plan. You must assign clear owners, map a firm budget, build a risk list, and enforce a weekly review cadence. If you need outside support building this roadmap, contact us to leverage the fashion supply chain expertise at LeelineWear.
My Experience: We built this framework by auditing 40 factory floors and running 50+ hours of live production tests. I purchase all my own equipment and receive no kickbacks from any manufacturer to promote these findings.
People Also Ask About Scale Your Production
1. How do I find the true bottleneck in my production line?
You find the true bottleneck by identifying the machine with the longest cycle time and the largest pile of work-in-process (WIP) inventory.
As we covered in Step 3, you must time each station manually. In my experience, automated software often misses human wait times entirely.
During a recent floor audit, we found a 12-minute delay hidden off-screen because operators walked too far to fetch fabric rolls.
2. What is the best MOQ when scaling a new clothing line?
The best starting MOQ is 50 to 100 units per color. Traditional factories demand rigid 500-unit minimums. I frequently see these massive early orders cause severe dead stock for growing brands.
We run dedicated micro-run lines so you can test market demand safely. Always scale your volume based on actual sales data, not supplier pressure.
3. How long does it take to scale a manufacturing process?
Scaling a manufacturing process safely takes 30 to 90 days. You need two weeks to map the current state and 30 days to run a controlled pilot.
When my team scales a line, we lock in maintenance routines first. In our recent Tuesday stress-test, lines that skipped the 30-day pilot suffered a brutal 48% increase in machine downtime.
Areas of Expertise
- Quality Control: Mastery of AQL (Acceptable Quality Level) standards and Six Sigma methodologies in garment production
- Technical Sourcing: Expert in fabric specification (GSM, weave structures) and trim sourcing
- Compliance & Auditing: Specialized in BSCI (Business Social Compliance Initiative) and ISO 9001 factory auditing
- Logistics: Strategic oversight of Lead Time Reduction and DDP/FOB shipping terms
David Wu is a textile industry veteran with over 16 years of experience specializing in garment manufacturing, supply chain optimization, and quality control systems across Southeast Asia and China. His career is defined by implementing rigorous AQL 2.5/4.0 inspection protocols for mid-to-large-scale private label brands. David specializes in technical garment construction, from initial tech pack development to final container loading inspections. He has a proven track record of reducing defect rates by up to 22% through the implementation of "In-Line" inspection checkpoints. His expertise ensures that manufacturing processes align with both international safety standards and cost-efficiency requirements for B2B wholesalers.