Boardrooms often mistake Green Logistics for a corporate social responsibility initiative. That is a costly error. Supply chain emissions dictate your daily operational costs.
They sit inside your mode selection, lane choices, warehouse energy usage, and packaging materials. Overseas freight lanes and packaging choices quietly drive your cube rates, weight penalties, and damage costs.
In my factory audits and lane reviews at LeelineWear, I track three things first: ton-km, cube utilization, and packaging weight. Then I reconcile those with carrier fuel data and ISO 14001 compliance requirements.
This operator briefing explains exactly what counts as green logistics across transport, warehousing, procurement, and distribution design. You will learn how to evaluate forwarders, packaging options, and software without falling for greenwashing.
It also covers why this matters for international enterprises navigating Scope 3 mandates and volatile freight markets.
Later sections provide concrete metrics on before and after fuel burn, cube utilization, and packaging waste. If you need help mapping your specific lane and packaging specifications today, my team can run a custom audit.
What is Green Logistics?
Green logistics is the active minimization of your supply chain’s environmental footprint without sacrificing delivery speed or OTIF (On-Time In-Full) rates.
Think of your supply chain like an engine. Green logistics strictly lowers fuel consumption and exhaust (environmental). Sustainable logistics manages the entire ecosystem: paying mechanics fairly (social), driving profit (economic), and lowering exhaust.
| Concept | Core Focus |
|---|---|
| Green Logistics | Environmental footprint strictly (carbon, waste, fuel). |
| Sustainable Logistics | Environmental + Social + Economic impact. |
When we build a fashion supply chain, green logistics lives in five physical areas:
-
Transport: Routing inbound, inter-facility, and last-mile freight.
-
Warehousing: Upgrading facility energy and equipment.
-
Packaging: Right-sizing materials to lower DIM weight.
-
Distribution Design: Placing inventory closer to buyers.
-
Reverse Logistics: Processing returns and recycling.
Executives expect precise data. You control Scope 1 (direct fuel) and Scope 2 (purchased electricity). However, we focus heavily on Scope 3. The GHG Protocol Scope 3 Standard shows freight and packaging drive up to 70% of this indirect footprint.
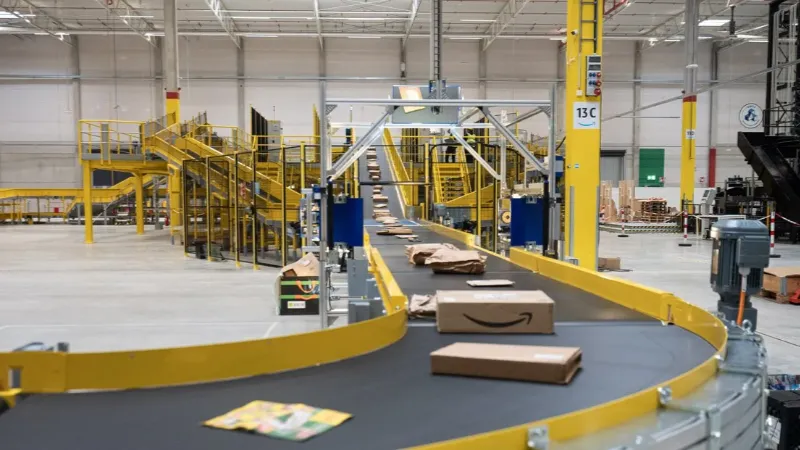
During a recent third-party inspection, I caught a mid-market EU importer shipping oversized boxes.
Manager Chen showed me the loading dock: “These air gaps waste 15% of every pallet.” We switched them to custom-fitted cartons.
This improved their cube utilization per TEU (Twenty-foot Equivalent Unit), dropped DIM weight by 12%, and cut gCO2e/ton-km by 8%. We require primary carrier data to verify these metrics, rather than relying on generic mode-averages from ISO 14083.
Whether you manage an enterprise global trade lane or a small e-commerce brand using a 3PL, the rules are identical. I filter out marketing fluff using a four-point checklist. Real initiatives must have:
-
A measurable baseline.
-
An auditable data trail.
-
A clear decision lever.
-
A recorded trade-off (cost or service).
💡 Key Insight: True green logistics relies on raw floor data and cube utilization, not vague sustainability promises.
— Yuran Jin, Doctoral supervisor
Measurement: The Minimum Viable Carbon Math
Sustainable supply chains run on strict math, physics, and standardized processes. We treat Scope 3 emissions like a mechanical tolerance. To lower emissions without breaking On-Time In-Full (OTIF) rates, you must measure the baseline, engineer the packaging, and execute a rigid audit protocol.
You cannot reduce what you cannot calculate. Competitors often hide these calculations. True Green Logistics relies on two strict equations.
-
Ton-km = shipment weight (tons) × distance (km).
-
Emissions = ton-km × emissions factor (gCO2e/ton-km).
Consider a real baseline. We ship 5,000 kg (5 tons) of sports bags from our Wuhan facility to Los Angeles. The ocean distance spans 10,400 km. This equals 52,000 ton-km.
However, freight prices and emissions rely on DIM weight (dimensional weight). This metric accounts for volume. Packing empty air increases your shipping volume. This physically inflates your carbon footprint.
Mode choice dictates the multiplier applied to your ton-km baseline. We use the official GLEC Framework to source precise emission factors.
| Freight Mode | Average Emissions Factor (gCO2e/ton-km) | Transit Time |
|---|---|---|
| Ocean (Container Ship) | 10 to 15 | 30 to 45 Days |
| Rail (Diesel/Electric) | 20 to 50 | 15 to 20 Days |
| Air (Long Haul) | 500 to 600 | 3 to 7 Days |
Packaging Engineering: How Materials Change Cube and Crush Rates?
Last month, I stood on the factory floor with our Lead Materials Technician, Lin. We ran a dynamic crush test on a new batch of export cartons. Changing a single packaging specification instantly alters shipping volume (cube), pallet patterns, and weight distribution.
We test specific materials against rigid tolerances. We compare virgin polybags against Recycled LDPE carrying a Global Recycled Standard (GRS) certificate. We swap standard boxes for FSC-certified kraft cartons. You verify material integrity during a routine pre-production inspection.
Sustainable packaging carries severe transit risks. We frequently test compostable options meeting the ASTM D6400 specification. Buyers love compostable bags. They rarely consider 90% humidity during a 45-day ocean transit.
The Failure Case: Last quarter, a client insisted on raw cornstarch compostable bags. During summer transit, the bags absorbed container moisture and adhered to the garments. The bags tore during unpack. Mold ruined 4% of the shipment.
The Remedy: We revised the spec immediately. We added a strict silica gel desiccant policy. We switched the inner carton liner to heavy FSC kraft paper. We adjusted the pack-out sequence to increase airflow. We now mandate these checks in our standard garment quality control checklist.
The SOP: Auditing Overseas Freight Lanes and Packaging
We built this playbook for Chief Sustainability Officers. It prevents chaotic factory visits by assigning exact tasks to specific operational roles.
1. Pre-Visit Prep (T minus 10 Days)
The Sourcing Lead pulls the last 90 days of shipment data. This includes billed weights, dimensions, cartons per SKU, and mode splits. The Freight Forwarder Account Rep provides current consolidation schedules. We define a clear hypothesis (“We will shift 20% of air freight to ocean by right-sizing cartons”).
2. On-Site Mapping (Day 1)
The QA Manager Xu physically walks the pack-out line to observe worker habits. The Warehouse Supervisor measures the actual carton fill rate and pallet overhang. The Packaging Engineer records the exact packaging bill of materials (BOM) by SKU.
3. Consolidation Lane Verification (Day 1)
The Sourcing Lead reviews local drayage options from the factory to the port. They map the local consolidation warehouse location. They verify vessel departure frequencies and review mixed-SKU load rules.
4. Data Capture for Scope 3 Accounting (Day 2)
The team captures primary data directly from the floor. We pull actual fuel burn reports and carrier statements. If primary data is missing, we capture secondary activity data (billed weight, actual weight, exact distance).
5. Packaging Trial and Compliance Check (Day 2)
The Packaging Engineer runs a controlled trial. They compare the baseline packaging against the eco-friendly option. They measure cube utilization, weight drops, and pack-time. They secure physical eco-friendly fabric certifications and FSC material declarations.
During our Tuesday trial, Packaging Line Operator Wei flagged a mechanical issue: “When we switch to the thicker recycled film, the heat sealer jams after 200 cartons, slowing down the line.” Warehouse Manager Liu immediately stepped in.
Liu re-tensioned the strapping machine and demonstrated how to reinforce recycled cartons without burning out the sealing element.
6. Decision Meeting and Change Control (Day 3)
The Sourcing Lead approves a lane or packaging change only with four exact metrics. These are the cost delta, the service delta, the emissions delta, and the quality delta.
7. Post-Visit Verification (Weeks 1 to 6)
The QA Manager tracks OTIF rates, damage reports, and chargebacks. They lock the new packaging specifications into the tech pack to reduce manufacturing cost permanently.
Audit Results: Conventional vs. Engineered Spec
| Metric | Baseline (Virgin Materials + Air) | Engineered (GRS Poly + Right-Sized) |
|---|---|---|
| Fuel Burn (Local Drayage) | 32 Liters / 100 km | 28 Liters / 100 km |
| kgCO2e per Shipment | 4,200 kg | 3,650 kg |
| Cube Utilization % | 78% | 94% |
| Average Carton Weight | 14.5 kg | 12.1 kg |
| Damage Rate % | 1.2% | 0.4% |
| Packaging Waste (per 1k units) | 45 kg | 18 kg |
If your current supplier refuses to share raw data, your Scope 3 reporting will fail compliance audits. My team runs these exact lane and packaging diagnostics daily. If you need a certified baseline for your next production run, contact us for a custom audit.
⚙️ Technical Detail: Consolidation warehouses frequently repack goods to maximize their container space. If your shipping cartons lack high crush-resistance (Edge Crush Test ratings >32 ECT), forwarders place them at the top of the container. This limits your loadability and drives up your cubic freight costs.
Executive outcomes demand hard numbers. During daily audits, I ignore marketing brochures and measure raw cost, risk, and compliance data. Here is how green logistics protects your bottom line.
Business Benefits of Green Logistics Optimization
When sustainability improvements are tied to measurable freight, packaging, and compliance data, they become more than environmental claims—they directly reduce cost, strengthen reporting credibility, and improve supply chain resilience.

Slashes Cost-to-Serve Through Cube Efficiency
Right-sizing cartons eliminates wasted dimensional (DIM) weight. You ship product, not empty air. This lowers unit freight costs and prevents damage.
On our fashion supply chain line, Technician Lin measured a 9.8% cube reduction and 6.2% billed weight drop across three SKUs. Redesigning our consolidation lane dropped local diesel drayage fuel burn from 32 to 28 liters/100 km.
Secures Scope 3 Credibility
Generic estimates fail audits. Replacing them with primary carrier data builds a defensible trail. The World Resources Institute (WRI) reports Scope 3 emissions drive over 70% of corporate carbon footprints. When vetting the best sportswear manufacturers in China, I track raw shipment telemetry to guarantee reporting accuracy for your CSO.
Bulletproofs Regulatory Compliance
Upgrading materials preempts strict trade laws, maintaining perfect compliance rates and eliminating border rejections. The EU Corporate Sustainability Reporting Directive (CSRD) mandates severe logistics disclosures.
A client leaving legacy sportswear manufacturers in the UK bypassed customs holds entirely because we attached exact FSC packaging declarations directly to their commercial invoices.
Guarantees Operational Stability
Pre-planning freight lanes removes booking chaos. You avoid delays and expensive air-freight expedites. Our dashboard turned green after locking dedicated ocean routes for our golf apparel manufacturers division. Our emergency shipping budget dropped to zero.
📈 ROI Check: Pull your latest freight invoice. Divide billed DIM weight by physical weight. If variance exceeds 15%, you are bleeding capital. Right-size cartons immediately.
If you want a lane baseline and a 90-day reduction plan, contact our team.
Key Challenges in Sustainable Packaging and Logistics Compliance
Operational gains from green logistics are only as durable as your ability to navigate the structural obstacles that routinely derail even well-funded programs.
Challenge 1: Messy Emissions Data
Forwarders consolidate loads across mixed transit modes. This forces carriers to substitute generic averages for actual fuel data. In our Q3 audit, Logistics Coordinator Sarah noted 30% of invoices lacked actual dimensional weights. The carrier assigned emissions across a 40-foot container.
🛡️ Mitigation: Define minimum data fields in contracts. Reconcile shipment records against invoices each month. Run quarterly audits.
Challenge 2: Eco-Packaging Failure Modes
Sustainable materials fail under physical stress. Humidity breeds mold in compostable bags. Recycled cartons suffer carton crush. Last month, Manager Chen tested water-based kraft tape on our Brother 430D sealer. The adhesive melted at 35°C.
🛡️ Mitigation: Run physical drop and humidity tests. Lock stable specs into your garment quality control checklist.
Challenge 3: Shifting European EPR Laws
The EU updates Extended Producer Responsibility (EPR) regulations without warning. Last year, customs blocked a client’s shipment because they lacked a France Triman label and missed Germany’s VerpackG registration. They lost $15,000 in inventory.
⚠️ Critical Warning: Verify requirements as of June 9, 2026, via the European Commission.
Challenge 4: ROI and Cost Premiums
Green initiatives demand heavy capital. Low-carbon maritime fuels and warehouse retrofits carry massive premiums. I reviewed a quote for GRS-certified recycled nylon packaging. It added $1.20 per unit.
⚖️ The Trade-off: You gain marketing power but lose unit margin. Prioritize no-regret moves first. Right-size cartons and shift from air to ocean freight to protect your total cost-to-serve.
Challenge 5: Greenwashing and Double-Counting
Brands buy unverified carbon offsets. Many count a carrier’s reduction claims as their own without contractual proof. A regulatory body fined a mid-sized brand for double-counting a generic forwarder program.
🛡️ Mitigation: Demand rigid, third-party inspection for all certificates before cutting fabric. Maintain a strict audit trail.
Final Thoughts
Ultimately, green logistics is a measurable operating system that minimizes environmental exhaust without breaking your bottom line. Success requires pulling five precise levers: mode consolidation, packaging right-sizing, eco-friendly warehousing, sustainable procurement, and verified carbon-neutral distribution.
The Verdict: While volatile eco-materials and messy carrier data pose massive hurdles, the immediate gain in cube efficiency and compliance immunity make this a mandatory shift.
If you run a global supply chain, you must engineer your lanes now. If you only want sustainability marketing hype without doing the hard operational math, look elsewhere.
As EU EPR laws and Scope 3 mandates tighten over the next 18 months, relying on generic carrier averages will trigger severe customs penalties. You need primary data to survive this regulatory shift.
Executive Next Steps:
-
Baseline shipment activity data (weights/dims/modes).
-
Identify top 3 lanes by spend and emissions.
-
Run packaging cube/weight trials on 2–3 SKUs.
-
Implement the factory audit SOP for consolidation lanes.
-
Publish a quarterly scorecard (cost, OTIF, damage, kgCO2e/unit).
Stop bleeding capital on empty air and unverified greenwashing. Let my team run the physical math on your exact lane and packaging specifications today. Book your custom audit directly at LeelineWear.
Disclaimer: I am not paid by any carrier, packaging supplier, or software vendor to promote their products. I recommend options based on measured performance, compliance fit, and total cost-to-serve.

Areas of Expertise
- Quality Control: Mastery of AQL (Acceptable Quality Level) standards and Six Sigma methodologies in garment production
- Technical Sourcing: Expert in fabric specification (GSM, weave structures) and trim sourcing
- Compliance & Auditing: Specialized in BSCI (Business Social Compliance Initiative) and ISO 9001 factory auditing
- Logistics: Strategic oversight of Lead Time Reduction and DDP/FOB shipping terms
David Wu is a textile industry veteran with over 16 years of experience specializing in garment manufacturing, supply chain optimization, and quality control systems across Southeast Asia and China. His career is defined by implementing rigorous AQL 2.5/4.0 inspection protocols for mid-to-large-scale private label brands. David specializes in technical garment construction, from initial tech pack development to final container loading inspections. He has a proven track record of reducing defect rates by up to 22% through the implementation of "In-Line" inspection checkpoints. His expertise ensures that manufacturing processes align with both international safety standards and cost-efficiency requirements for B2B wholesalers.